Electricity costs in Sweden have varied sharply over the past few years. The figures in the Nils Holgersson report show a pattern clearly different from the one in water and sewage charges. Rather than a steady climb, the pattern is sharp swings from one year to the next.
The total electricity cost in the report is made up of several parts: the electricity supply price, the grid fee, electricity tax and VAT. In this summary, Nordic Propeye goes through how the total electricity price developed between 2020 and 2025, and takes a closer look at the grid fee, which has become an increasingly large share of the cost.
Electricity prices vary between counties
When the municipalities' total electricity costs are combined into a county average, the differences in cost level become clear. Some counties sit higher than others, but what stands out most is how quickly conditions can change.
Total electricity cost 2025
| County | Total electricity cost 2025 (kr/m², incl. VAT) |
|---|---|
| Blekinge | 136.56 |
| Dalarna | 124.05 |
| Gotland | 143.78 |
| Gävleborg | 107.98 |
| Halland | 138.18 |
| Jämtland | 121.11 |
| Jönköping | 128.2 |
| Kalmar | 146.03 |
| Kronoberg | 148.96 |
| Norrbotten | 104.3 |
| Skåne | 150.23 |
| Stockholm | 126.71 |
| Södermanland | 126.73 |
| Uppsala | 132.22 |
| Värmlands län | 120.3 |
| Västerbotten | 103.93 |
| Västernorrland | 118.55 |
| Västmanland | 128.66 |
| Västra Götaland | 121.61 |
| Örebro | 134.79 |
| Östergötland | 135.99 |
Sharp swings over time
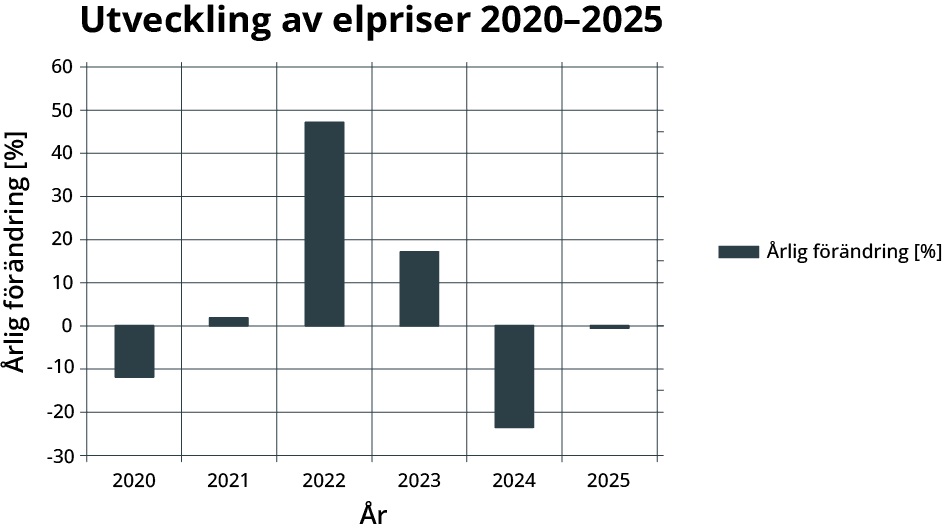
The period from 2020 to 2025 is marked by clear rises and falls. After relatively small changes in 2020 and 2021 came a steep increase in 2022, when electricity prices climbed markedly across the country.
Since then it has moved the other way, with clear falls in 2024 and a more muted change in 2025.
| County | 2020 | 2021 | 2022 | 2023 | 2024 | 2025 |
|---|---|---|---|---|---|---|
| Blekinge | -11.7 | 2.92 | 68.92 | 17.3 | -28.1 | 3.9 |
| Dalarna | -11.85 | 3.12 | 52.43 | 16.84 | -26.25 | 1.38 |
| Gotland | -9.5 | 3.2 | 53.1 | 15.3 | -22.6 | 4.1 |
| Gävleborg | -11.88 | 3.64 | 27.71 | 22.82 | -19.66 | -8.04 |
| Halland | -13.62 | 2.8 | 64.78 | 19.6 | -25.6 | 2.68 |
| Jämtland | -10.58 | 3.35 | 13.81 | 22.11 | -9.9 | -8.21 |
| Jönköping | -13.21 | 3.88 | 53.57 | 19.16 | -25.54 | 0.02 |
| Kalmar | -12.82 | 3.13 | 60.43 | 18.01 | -25.16 | 3.62 |
| Kronoberg | -14.73 | 3.21 | 64.16 | 18.38 | -25.04 | 4.04 |
| Norrbotten | -11.71 | -0.21 | 15.39 | 17.44 | -10.79 | -8.41 |
| Skåne | -12.1 | 3.29 | 63.38 | 17.56 | -23.96 | 3.92 |
| Stockholm | -11.83 | 1.96 | 50.69 | 16.59 | -25.29 | 1.66 |
| Södermanland | -11.5 | 0.96 | 49.87 | 15.72 | -24.03 | 1 |
| Uppsala | -10.72 | 1 | 47.92 | 15.5 | -22.66 | 1.54 |
| Värmlands län | -11.5 | -1.91 | 48.34 | 15.8 | -28.81 | 1.01 |
| Västerbotten | -11.67 | 1.2 | 15.31 | 19.79 | -12.39 | -10.1 |
| Västernorrland | -10.69 | 3.4 | 16.5 | 24.79 | -10.36 | -10.4 |
| Västmanland | -11.07 | 3.42 | 52.87 | 16.89 | -22.93 | 1.08 |
| Västra Götaland | -11.9 | 1.97 | 51.21 | 16.67 | -26 | -0.13 |
| Örebro | -13.69 | 1.73 | 47.51 | 18.45 | -24.23 | 0.51 |
| Östergötland | -13.67 | 1.38 | 47.91 | 17.33 | -22.56 | 0.89 |
Large variations at national level too
The same pattern shows up at national level. The chart below shows how the total electricity price changed year by year between 2020 and 2025.
The grid fee keeps climbing
While the electricity price has swung sharply, grid fees in most counties have moved steadily upwards. That makes the grid fee an ever larger part of the total electricity cost.
| County | 2020 | 2021 | 2022 | 2023 | 2024 | 2025 |
|---|---|---|---|---|---|---|
| Blekinge | 2.46 | -1.36 | 7.16 | 15.64 | -1.49 | 13.41 |
| Dalarna | 1.83 | -0.47 | 3.93 | 8.67 | 2.07 | 12.78 |
| Gotland | 5.4 | 0 | 13.6 | 6.4 | 6.73 | 16.27 |
| Gävleborg | 1.55 | 0.46 | 4.15 | 9.59 | -2.67 | 9.12 |
| Halland | -2.08 | -2.15 | 7.13 | 21.83 | 4.53 | 11.41 |
| Jämtland | 1.38 | 0.31 | 0.52 | 5.2 | 8.76 | 10.57 |
| Jönköping | -1.55 | 0.98 | 2.81 | 17.08 | 3.04 | 8.4 |
| Kalmar | -2.04 | -0.43 | 4.99 | 16.45 | 5.78 | 12.18 |
| Kronoberg | -6.41 | -0.35 | 4.22 | 18.46 | 5.31 | 11.97 |
| Norrbotten | 0.93 | -6.2 | 0.65 | -4.01 | 9.99 | 12.79 |
| Skåne | -0.18 | 0 | 3.47 | 16 | 10.72 | 11.14 |
| Stockholm | 0.75 | -2.75 | 2.8 | 8.28 | 3.82 | 13.85 |
| Södermanland | 1.59 | -4.52 | 1.12 | 5.82 | 10.16 | 11.59 |
| Uppsala | 2.65 | -4.16 | 0.8 | 5.75 | 12.35 | 12.04 |
| Värmlands län | -0.2 | -9.54 | 0.45 | 6.21 | -7.67 | 13.18 |
| Västerbotten | 0.79 | -3.74 | 0.91 | -1.98 | 7.47 | 9.55 |
| Västernorrland | 2.57 | 0.23 | 5.06 | 10 | 9.1 | 6.05 |
| Västmanland | 4.84 | 0.13 | 5.03 | 9.52 | 13.69 | 11.55 |
| Västra Götaland | 1.34 | -2.88 | 2.02 | 8.46 | 3.31 | 9.78 |
| Örebro | -5.21 | -2.73 | 2.27 | 14.55 | 1.93 | 9.59 |
| Östergötland | -5.02 | -3.58 | 2.09 | 11.07 | 9.44 | 9.92 |
Why the grid fee matters for housing associations
The difference between the electricity supply price and the grid fee is central. A number of things affect the supply price: supply and demand, weather conditions, electricity generation, transmission capacity between bidding zones, and international energy markets. These are factors raised by Energimarknadsinspektionen.
Because Sweden is part of the European electricity market, changes in both generation and demand can feed through to the supply price quickly, a point Energimyndigheten also makes in its description of the Swedish electricity system.
The electricity grids, by contrast, work as local monopolies, which means a property owner or housing association cannot choose its grid company the way it can choose a supply contract. When grid fees rise there are therefore few direct ways to influence the grid cost itself. Energimarknadsinspektionen has already decided that the grid companies may raise their prices by up to 44 % over 2024–2027, which means many housing associations may have to plan for continued increases in grid costs.
One answer to the rising grid costs is to review how electricity is bought and how subscriptions are structured. This is where shared electricity with IMD becomes relevant.
Shared electricity with IMD: a solution for housing associations
With shared electricity with IMD, individual metering and billing, the individual apartment subscriptions and their fixed grid fees are replaced by a single subscription for the whole property. Residents are still billed for their own electricity use, but the association can cut the number of fixed charges and thereby lower the total electricity cost.
Gathering the whole property's electricity use into one subscription also gives the housing association more negotiating power, and it often means a better supply contract that benefits both the association and the residents.
➡️ Read more about IMD Electricity for properties and housing associations.
In the next part of our review of the Nils Holgersson report we look more closely at district heating prices.