Water and sewage costs continue to be a growing share of what it costs to run a home. The figures in Nils Holgersson-rapporten 2025 show both large regional differences and a clear rise over time. The report compares the costs of electricity, district heating, water and sewage across Sweden's municipalities and is often used as a gauge of how housing operating costs are developing around the country.
We at Nordic Propeye have gone through the material and compiled the most important insights for you, along with the development between 2020–2025. We start with water and sewage, a cost item that has shown a clear upward trend for several years.
Water and sewage rates vary widely between counties
The differences between the country's regions are clear. When municipal water and sewage rates are averaged by county, large variations in cost level emerge.
Average water and sewage rate by county, 2025
| County | Water and sewage rate 2025 (kr/m² incl. VAT) |
|---|---|
| Blekinge County | 106.04 |
| Dalarna County | 118.19 |
| Gävleborg County | 114.33 |
| Halland County | 103.70 |
| Jämtland County | 119.46 |
| Jönköping County | 93.46 |
| Kalmar & Gotland Counties | 123.16 |
| Kronoberg County | 100.83 |
| Norrbotten County | 98.53 |
| Skåne County | 105.21 |
| Stockholm County | 108.94 |
| Södermanland County | 133.42 |
| Uppsala County | 116.84 |
| Värmland County | 113.92 |
| Västerbotten County | 103.23 |
| Västernorrland County | 122.53 |
| Västmanland County | 86.41 |
| Västra Götaland County | 110.52 |
| Örebro County | 104.92 |
| Östergötland County | 89.92 |
In some counties the average rate is considerably higher than in others. The gap between the most and least expensive counties is in several cases over 40 per cent, which shows how different the conditions can be between the country's municipalities.
Water and sewage charges have risen year after year
Looking at the development over time, the trend becomes even clearer. In many counties, water and sewage charges have risen continuously over the 2020–2025 period.
Water and sewage: average price increase [%] by county
| County | 2020 | 2021 | 2022 | 2023 | 2024 | 2025 |
|---|---|---|---|---|---|---|
| Blekinge County | 4.00 | 6.16 | 3.84 | 11.08 | 14.38 | 8.74 |
| Dalarna County | 3.79 | 5.70 | 3.91 | 8.73 | 12.67 | 13.03 |
| Gävleborg County | 5.65 | 4.50 | 3.95 | 5.35 | 11.13 | 9.70 |
| Halland County | 4.03 | 4.28 | 3.13 | 7.77 | 15.52 | 17.02 |
| Jämtland County | 5.80 | 4.78 | 2.60 | 6.56 | 15.08 | 7.66 |
| Jönköping County | 2.64 | 2.98 | 4.41 | 8.09 | 14.38 | 8.82 |
| Kalmar & Gotland Counties | 3.90 | 4.01 | 4.62 | 12.72 | 11.40 | 11.32 |
| Kronoberg County | 2.14 | 1.54 | 4.99 | 4.72 | 6.29 | 10.35 |
| Norrbotten County | 4.72 | 4.43 | 4.38 | 6.14 | 12.36 | 8.18 |
| Skåne County | 4.76 | 5.15 | 5.42 | 8.63 | 18.68 | 11.15 |
| Stockholm County | 3.12 | 6.83 | 4.75 | 10.05 | 23.33 | 17.51 |
| Södermanland County | 3.93 | 5.17 | 1.63 | 11.94 | 18.91 | 15.50 |
| Uppsala County | 4.61 | 0.78 | 2.06 | 4.58 | 24.31 | 9.24 |
| Värmland County | 2.24 | 2.01 | 3.42 | 8.27 | 10.40 | 11.71 |
| Västerbotten County | 6.07 | 4.37 | 4.47 | 8.15 | 8.69 | 7.53 |
| Västernorrland County | 2.06 | 3.60 | 4.77 | 6.50 | 14.43 | 9.50 |
| Västmanland County | 3.73 | 4.59 | -3.80 | 10.10 | 20.80 | 6.65 |
| Västra Götaland County | 4.89 | 5.36 | 4.54 | 8.07 | 11.82 | 9.60 |
| Örebro County | 2.37 | 12.30 | 6.67 | 6.78 | 9.71 | 11.72 |
| Östergötland County | 3.46 | 4.15 | 2.40 | 4.33 | 9.68 | 10.24 |
For property owners this means that water and sewage make up an ever larger share of operating costs. The development is also expected to continue upwards. From 2025/2026, new limit values for drinking water and requirements for raw water monitoring are being introduced, in part linked to PFAS and in line with the EU's updated drinking water directive. The new requirements mean considerably stricter rules for water treatment and monitoring, which in many cases calls for large investments in new treatment technology. For the water and sewage utilities that means higher costs, which in turn is expected to push water and sewage rates up further in the years ahead.
Water and sewage rates have risen sharply across the country
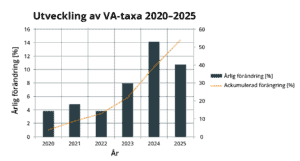
The tables above show how the development looks in different parts of the country. The trend is just as clear at national level. Since 2020, water and sewage rates have risen sharply in Sweden.
The chart below shows the total development in the country over the 2020–2025 period. The accumulated change shows the total increase across the period, where each year's change builds on the previous year's level.
When water costs rise, consumption matters more
As water and sewage charges rise, so does the interest in getting better control of water consumption in buildings.
One solution that more and more property owners are looking at is IMD Water, individual metering and billing. By measuring consumption per apartment you can create a fairer distribution of costs and in many cases also reduce total water use.
➡️ Read more about IMD Water and individual metering of water in buildings.
In the next part of our review of Nils Holgersson-rapporten we take a closer look at electricity prices and the sharp swings that have shaped the market in recent years.